Event Search
Introduction
The Event Search subpackage is based on Matlab routines available at LPP and further developed, and on the Mission subpackage. It allows to search for events related to specific scientific processes (e.g. reconnection, turbulence, shocks, particle acceleration etc) in spacecraft open-access databases, and produce a list of the associated time intervals, by defining criteria to be fulfilled by some parameters (e.g., location of the spacecraft, magnitude of magnetic field and currents, etc). The output of are ASCII files with header information (date, spacecraft etc.) and time intervals, to be further used by other AIDApy subpackages e.g. Machine Learning tools. The Event Search tool also produce summary plots of the listed events, to allow the user to eyeball the automatic selection.
The main features of the Event Search subpackage are:
handling of various scientific processes (such as magnetic reconnection electron and ion diffusion regions and separatrices, plasma jet fronts, coherent structures in turbulence, particle acceleration sites at shocks, etc) in different regions of the heliosphere;
additional search parameters (e.g. density gradients, amplitude of magnetic and electric fluctuations, etc), and/or scientific processes can be added by the user according to his needs without any change to the program itself;
handling of various missions by using the Mission tool capabilities; precise control of the data by using the Mission tool capabilities. The query can ask for specific time ranges, spatial regions, probes, subprocesses, etc. The module will check the availability of the data and will ensure that the user processes the latest version of the data files;
basic plotting functionalities for the user (summary plots) to be able to eyeball the results
Inputs
The philosophy of this subpackage and more generally AIDApy is to ease as much as possible the user experience. To this end, we decided to minimize the number of arguments entered by the user and the knowledge required to obtain the desired data. However, for the code to be flexible and scalable, the user can also input a customized search and/or parameters. Below is a list of the parameters the code needs from the user:
The first input is the
start_timeand theend_timeof the requested interval as a Pythondatetime.datetimeobject written as:datetime(year, month, day, hour, minute, second)or an astropy. Time object allowing to handle multiple time format such as GPS, ISOT, or FITS.The second input is a Python dictionary of the
settingswhich allow to customize the search. Note that for the sake of clarity, thesettingsare divided into two groups:- The
parameterswhich include: The first parameter is a string specifying the mission from which to download the data:
'mission' = '<mission>'.The second parameter is a list of strings, containing the different probes of the multi spacecraft mission considered:
'probes' = ['<probe1>', '<probe2>', ...]. Note that for the single spacecraft mission or if one wants data from all probes, the string is set to “all” by default.The third parameter is a string specifying the coordinate system the user wants the data to be used in, such as:
'coords' = '<coord_system>'. Note that for the sake of clarity, it has been decided that data can be retrieved in only one coordinate system at once. By default, the coordinate system is set to Geocentric Solar Ecliptic (GSE).The fourth parameter is a string specifying the data rate or instrument mode used to find the events
The fifth and sixth parameters are the length (in seconds) of the rolling time window and the leap step (also in seconds), respectively.
- The
- The
criteriawhich the data should fulfill: The parameter to enter is a python
lambdafunction containing the data products (from the sample catalog of available data products on AIDApy shown in Mission subpackage) which are required to search for the specific process defined by the user. Each keyword should be accompanied with the criterion to be fulfilled (see code snippet below). For more complex searches, these operations can be applied on each dimension of 2D arrays such as vector components and on different probes. Note that the vector components should be referred as ‘x’, ‘y’ and ‘z’, and the magnitude as ‘tot’; the different probes should be referred as ‘1’, ‘2’, ‘3’, or ‘4’. For instance, to ensure that one spacecraft from a fleet is in the Earth’s magnetotail (\(X_{GSM} \leq -5 R_E\) and \(|Y_{GSM}| \leq 15 R_E\), \(R_E\) being the Earth radius and GSM standing for the Geocentric Solar Magnetic coordinate system) and its separation distance in the GSM XY plane with a second spacecraft is smaller than 100 km, the criterion can be defined as follows (the spacecraft location being referred as ‘sc_pos’ in AIDApy):
- The
lambda sc_pos_x1, sc_pos_y1, sc_pos_x2, sc_pos_y2: (sc_pos_x1 <= -5 * 6378) & (abs(sc_pos_y1) <= 15 * 6378) & (sqrt((sc_pos_x1 - sc_pos_x2)**2 + (sc_pos_y1 - sc_pos_y2)**2) < 100)
Note: We recommend to use Numpy mathematical functions (e.g., numpy.abs, numpy.sqrt), as they are usually more compatible with Numpy arrays used for arithmetic operations in the subpackage.
Below is a code snippet showing how to define the input parameters to the event_search function:
# Import Python modules
from aidapy import event_search
from datetime import datetime
import numpy

# Define desired time interval
start_time = datetime(<year>, <month>, <day>, <hour>, <minute>, <second>)
end_time = datetime(<year>, <month>, <day>, <hour>, <minute>, <second>)

# Define parameters relevant to the queried scientific process
settings = {"criteria": {lambda <var1>, <var2>: <var1> < <threshold1>, <var2> > <threshold2>}}
            "parameters": {'mission': '<mission>',
                           'probes': ['<probe1>', '<probe2>', '<probe3>'],
                           'mode': '<mode>',
                           'time_window': '<value>',
                           'time_step': '<value>'},


# Search for events using the list_events subpackage
event_search(settings, start_time, end_time)
Note that the names of the parameters should be compliant with the AIDApy catalog of products (a sample is shown in the Mission subpackage description). Once the parameters are set up, the Event Search subpackage can be called to search for the desired events associated with the specific scientific process. The outputs of this subpackage are discussed in the following section.
Outputs
As stated above, the first output of the Event Search subpackage is a list of the found events. This list is written in a standard ASCII file, so that it can be easily loaded by other subpackages of the AIDApy package, such as Statistical, Machine Learning and Deep Learning tools. This file also contains additional header information such as the scientific process/sub-process of interest, the parameters used for the search, the spacecraft location, etc. The output file names also contains the scientific process and the run parameters. The output files are stored in a folder named after the date and time when the search has been performed.
An example of such file is shown below:
Output_list_events_<prod1>_<threshold1>_<prod2>_<threshol2>_timewindow_<value>_step_<value>.txt:
Scientific process: <optional>
Mission: <mission>
Probes: <probes>
Coordinates: <optional>
Criteria: <prod1> <var1> < <threshold1>, <prod2> <var2> < <threshold2>
List of events found:
            Tint (UTC)                                         S/C location (km)
2017-08-10T12:18:31.728287000/2017-08-10T12:19:41.208817000    -96743.35/16839.555/30637.818
Plotting
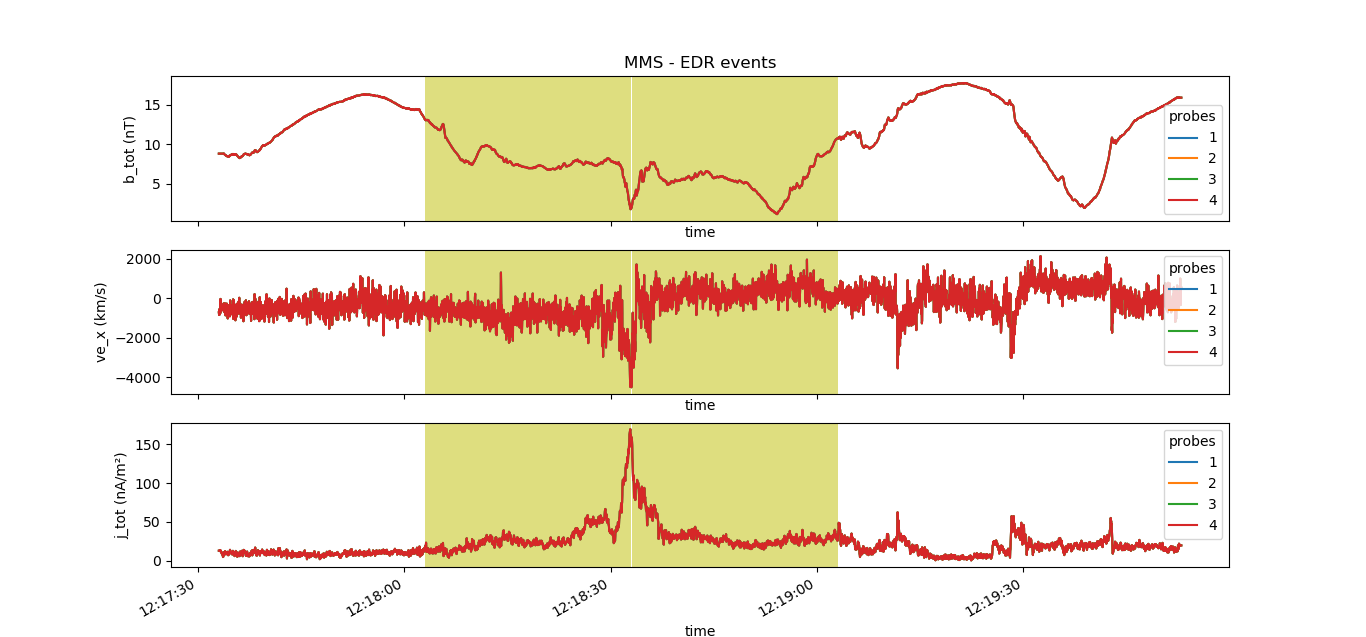
Here we show the basic plotting functionalities of the Event Search subpackage. A simple summary plot of all data loaded by the subpackage is displayed for the querid time interval, so that the user can eyeball the results. Only the data products on which criteria are applied are shown in different panels for the queried probes. The events found are highlighted in each panel.
The figure below shows the output plot obtained using the Event Search subpackage, for the use case of EDRs in the examples: